This project was an exercise in data visualization with a tie-in to charity, specifically worldwide access to water. The graphic elements animate upon tap and show related statistics.
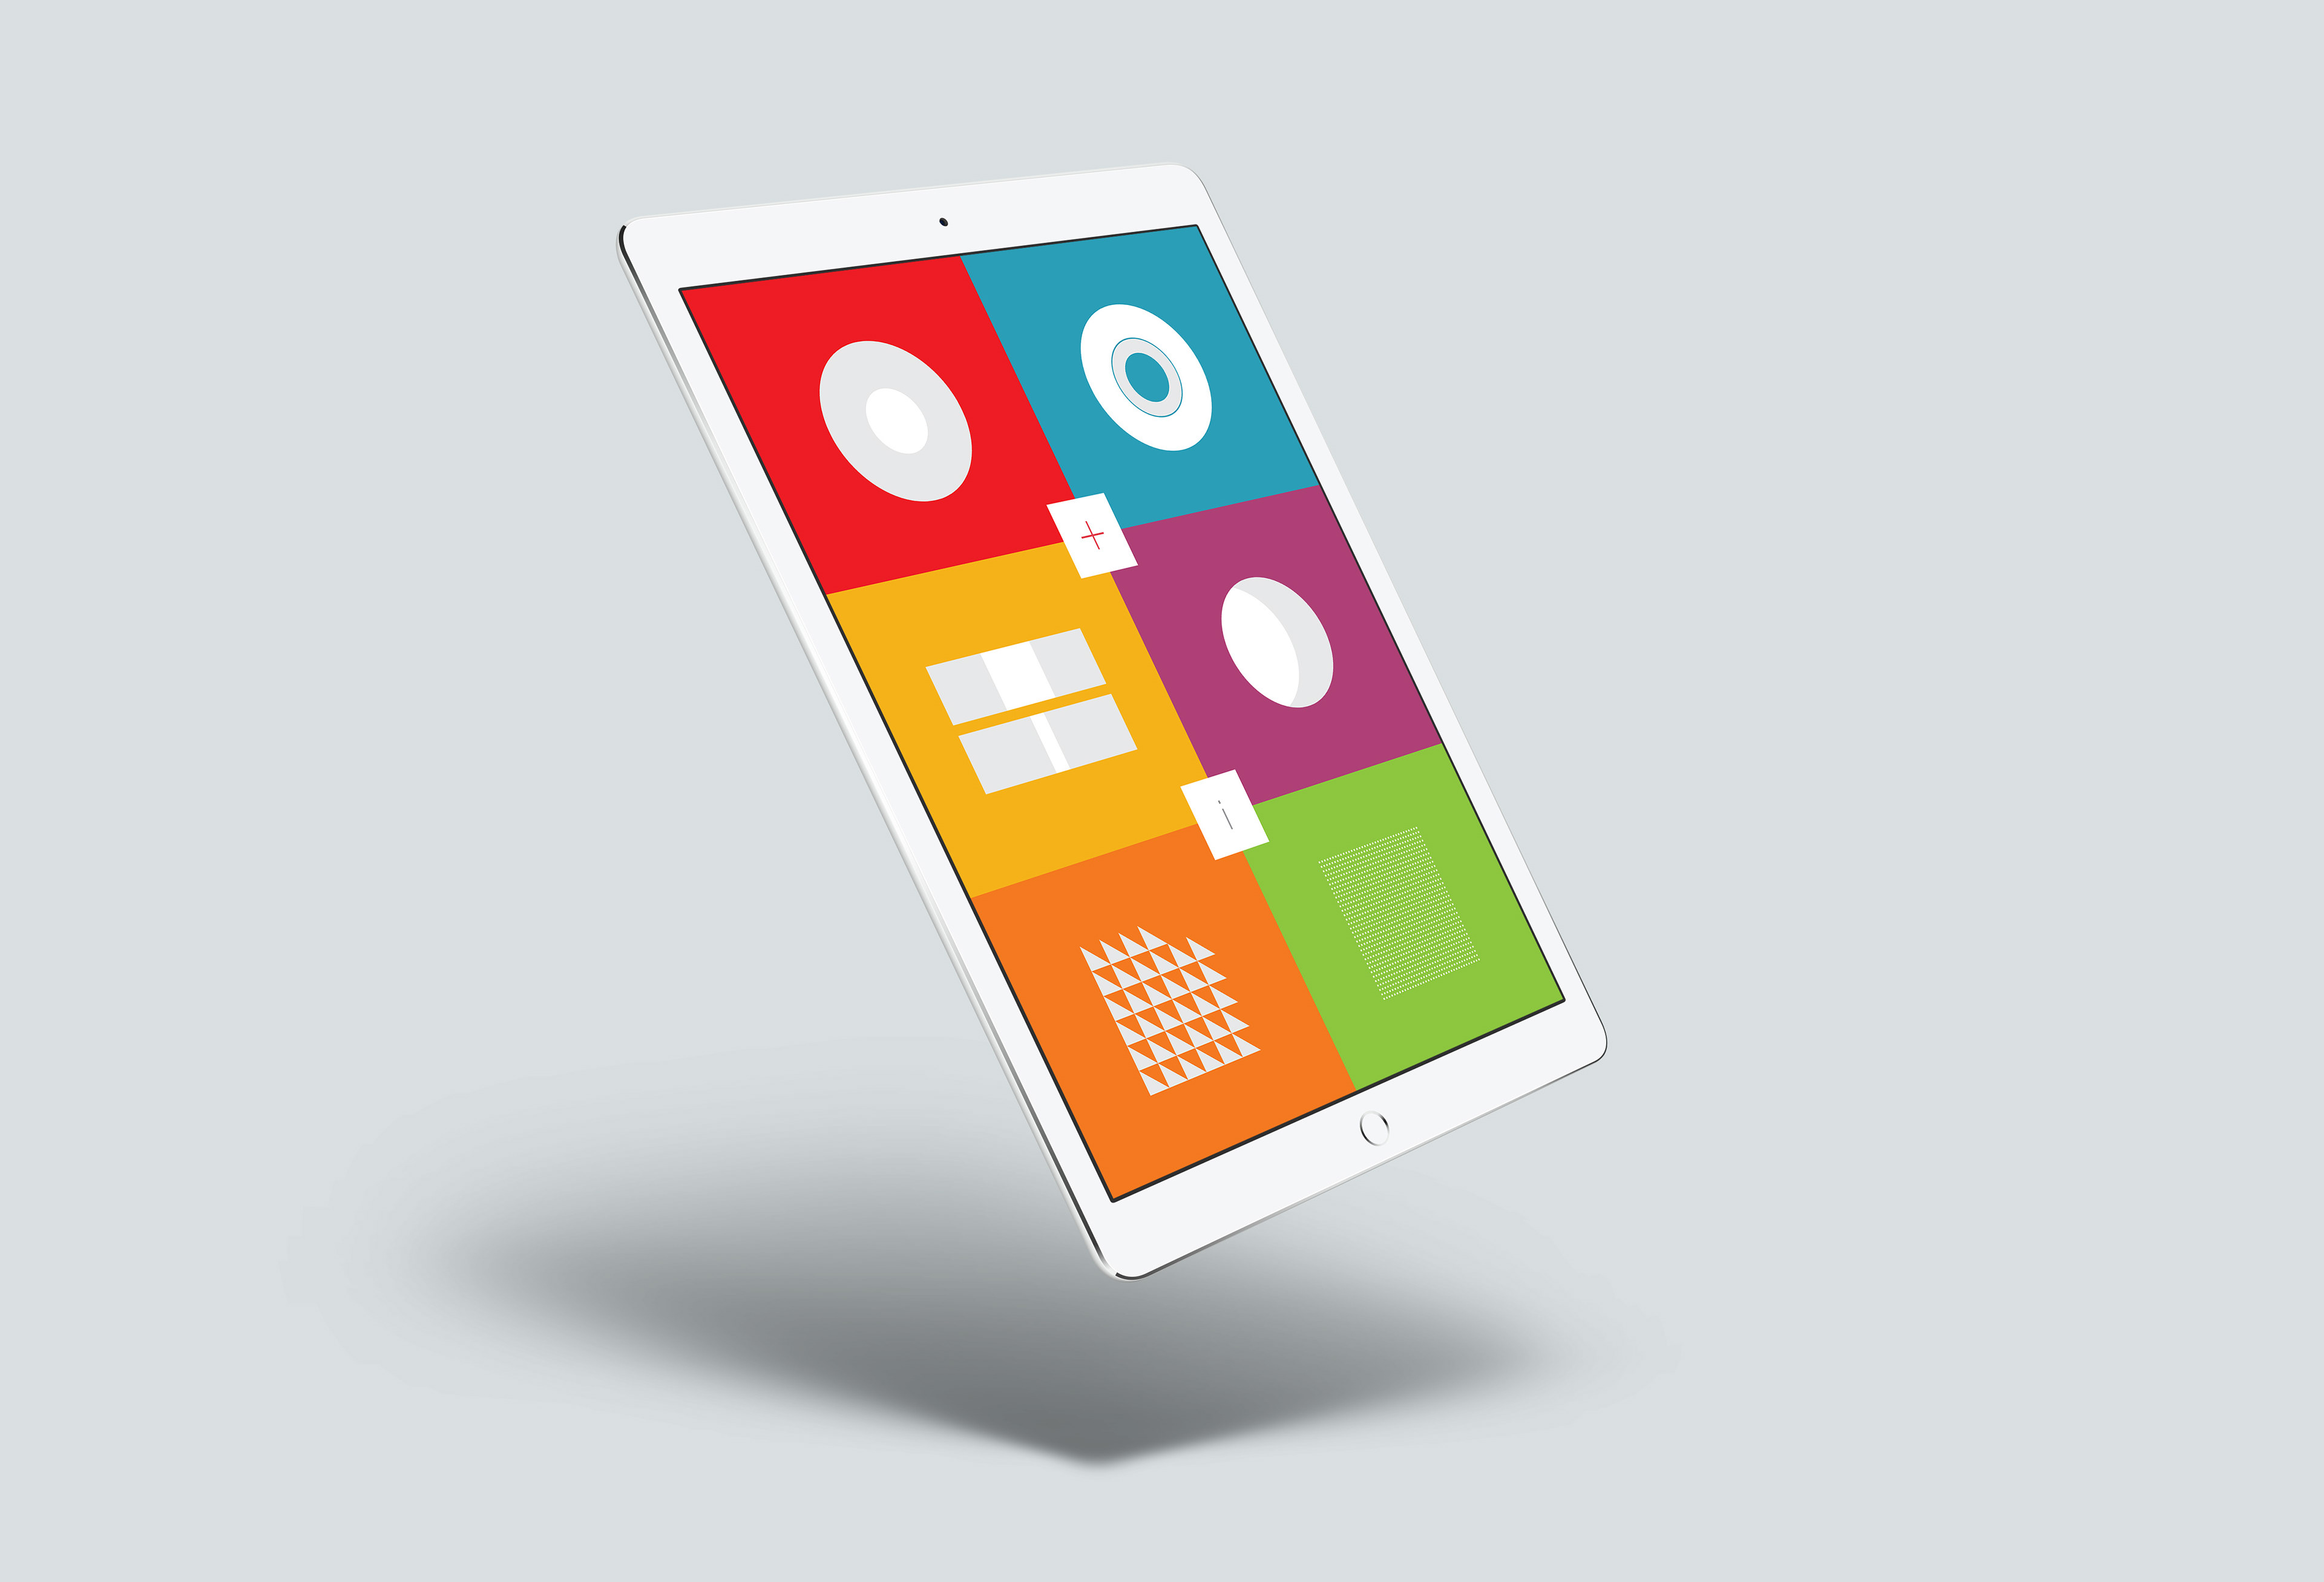
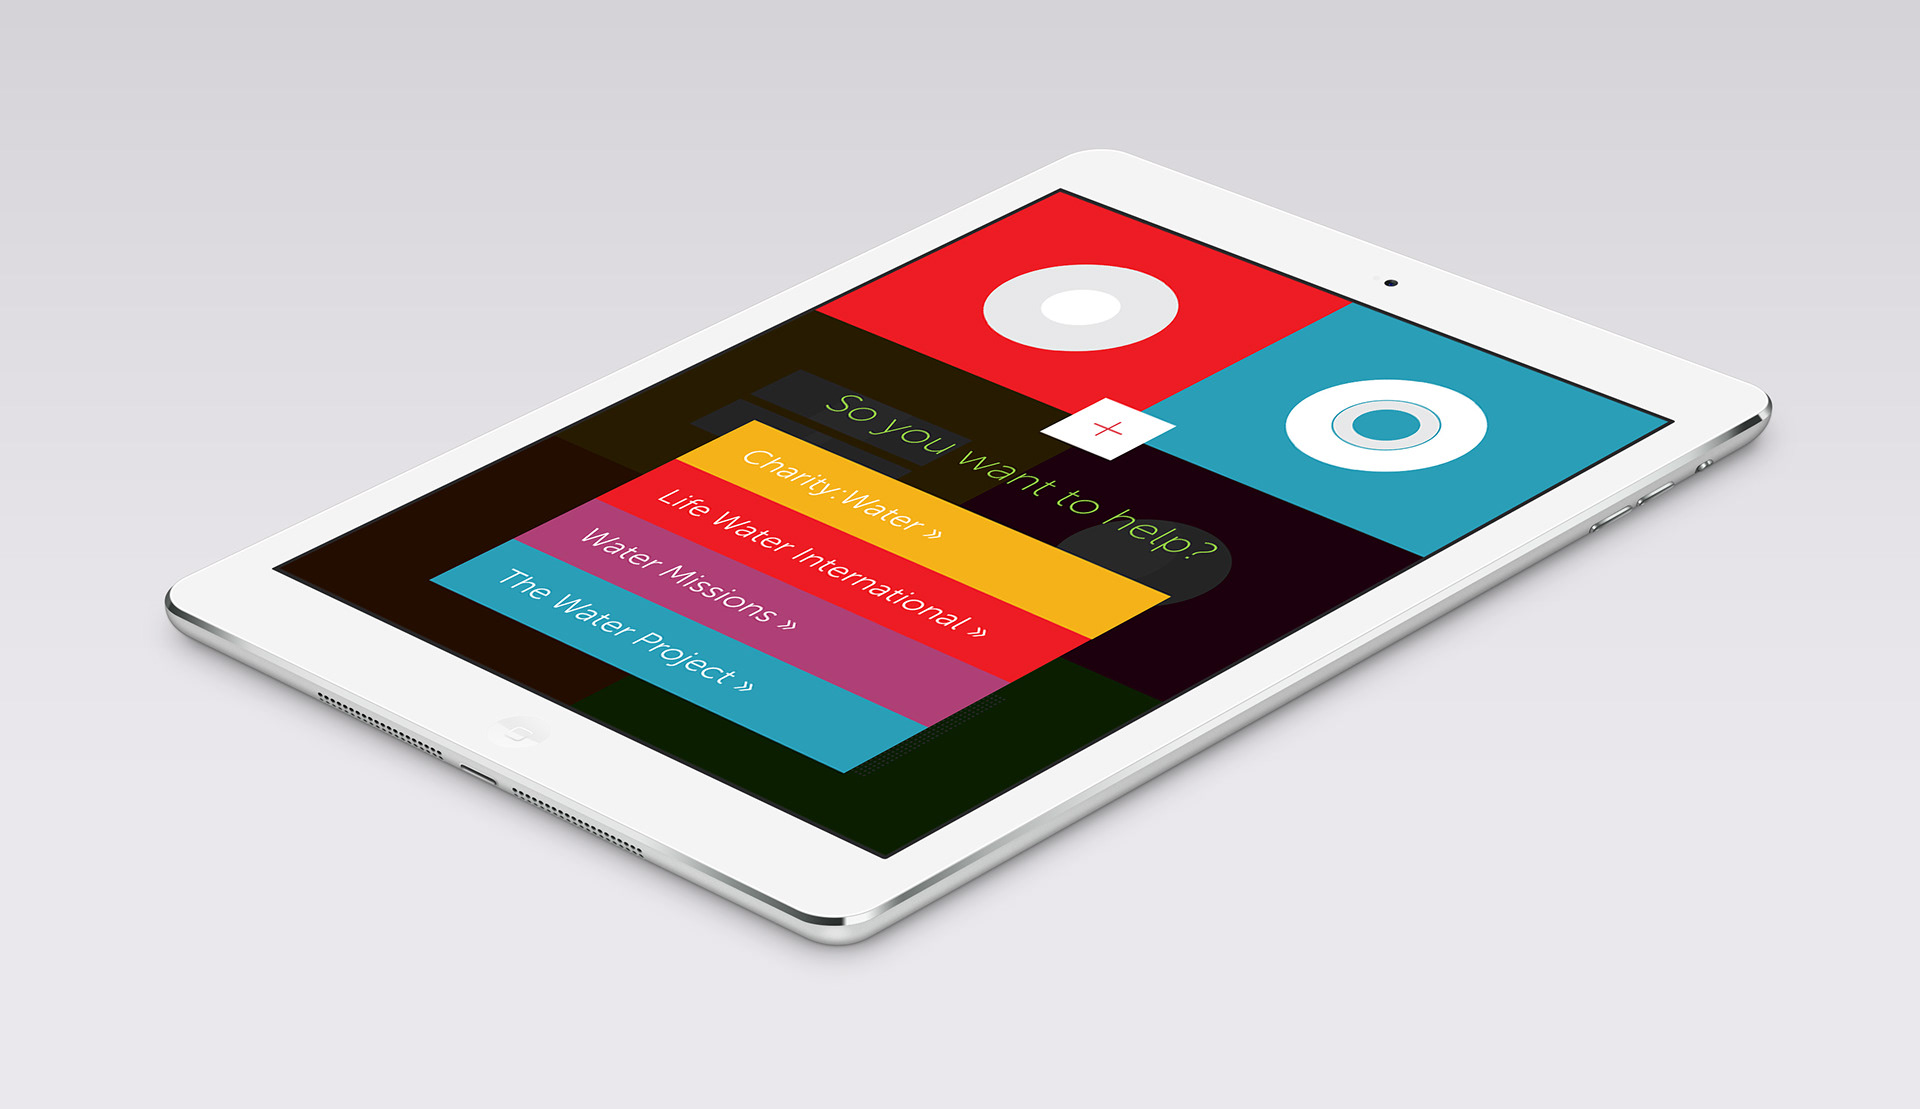


The goal of this project was to display information in a compelling way that shows the lack of access to proper sanitation and water. I choose to make an interactive minimalist style iPad app. All of the graphics below have animations that play when you tap on them via the app.